Loading...
Using Artificial Intelligence (AI) on ASTM standards and related intellectual property is prohibited. Violations will result in suspension of access.

By Carol Parendo
Aug 05, 2025
Process capability index (Cpk) and process performance index (Ppk) are typically used to quantify the performance of a process compared to its specification. Unfortunately, there are many misconceptions regarding these indices, so let’s go back to basics.
Let’s start with the core calculations. The equations when you have bilateral tolerance are in the table below:
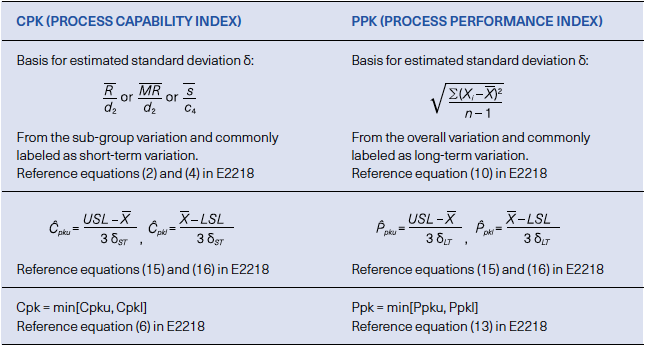
Both Cpk and Ppk are derived using the minimum of the upper and lower calculations. The main difference is their estimation of the process’s standard deviation (δ).
When calculating δ for Cpk:
Conversely, when calculating δ for Ppk:
One final word about math before we move to the next question. These equations have two assumptions:
There are many common misconceptions regarding Cpk and Ppk. It can be incorrectly assumed that they are interchangeable. They are not, and therefore, it is possible to use both and compare them for more information. As mentioned earlier, they use different standard deviation estimates.
Inconsistent terminology often adds to the confusion. Cpk may be labeled as “short-term,” “potential,” or “within,” while Ppk may be labeled as “long-term” or “overall.” However, using these descriptors without clearly stating whether you are referring to Cpk or Ppk can lead to misunderstandings. If you use a descriptor, always pair it with the appropriate index to ensure clarity.
Be cautious of labeling Ppk as “long-term,” especially if your dataset was collected over a short time span and does not reflect true long-term sources of variability. In such cases, calling it “long-term” may be misleading. Make sure the context of your data is clearly communicated so that others do not incorrectly assume your Ppk accounts for extended variation over time. The context and quality of your data are critical. Since no dataset is ever perfect, ask the following questions:
Although checking the assumptions of stability and normality is best practice, it is not always done, especially when indices are calculated automatically at-scale in certain software tools. This can lead to overlooked assumptions and misleading results. Be aware of this potential gap and consider reviewing a focused subset of processes where results appear questionable or where decisions carry higher risk. These targeted checks can provide the necessary insight without overwhelming resources.
The purpose of these indices extends far beyond simply passing a threshold. For those less familiar, industry standards, customer requirements, or internal requirements commonly require a minimum Cpk or Ppk value of 1.33 or 1.67. However, these metrics are more powerful than pass/fail checks – they are valuable tools for predicting future process performance. Will the process remain capable once it is in full production? Can it tolerate the inherent variability that we cannot fully control? Using Cpk and Ppk effectively helps identify potential issues early, while the stakes are still low, and corrective actions are more manageable.
Many practitioners tend to favor Cpk when working with control charts or during process qualification because it reflects the potential capability of the process, assuming process control and no process shifts and drifts.
On the other hand, Ppk is often preferred for evaluating the actual performance of a process over time, which may include shifts and drifts of the process.
In practice, both indices can be used and compared. When Cpk and Ppk values are similar, it generally indicates that the process is stable and predictable. However, if Ppk is significantly higher than Cpk, this signals potential process instability. The next step is to investigate whether the variation is due to shifts or change over time (different lots of material, tool changes, machine setups, or environmental factors), or whether the variation means the dataset includes older data that no longer reflect the current state of the process. Understanding these distinctions is critical for drawing accurate conclusions and driving meaningful improvement.
Both Cpk and Ppk are powerful tools to assess the capability and performance of a process. Here, major sources of potential confusion have been clarified, allowing practitioners to apply them appropriately. Following these best practices will lead to more informed decisions and confidence in data-driven conclusions.
1) Standard practice for process capability and performance measurement (E2281).
2) Standard practice for use of control charts in statistical process control (E2587). ●
Carol Parendo is a senior technical fellow for enterprise quality at Collins Aerospace. She has over 35 years of experience as a mechanical engineer and statistician in both the aerospace and medical-device fields. Parendo is a member-at-large for the committee on quality and statistics (E11).
July / August 2025


